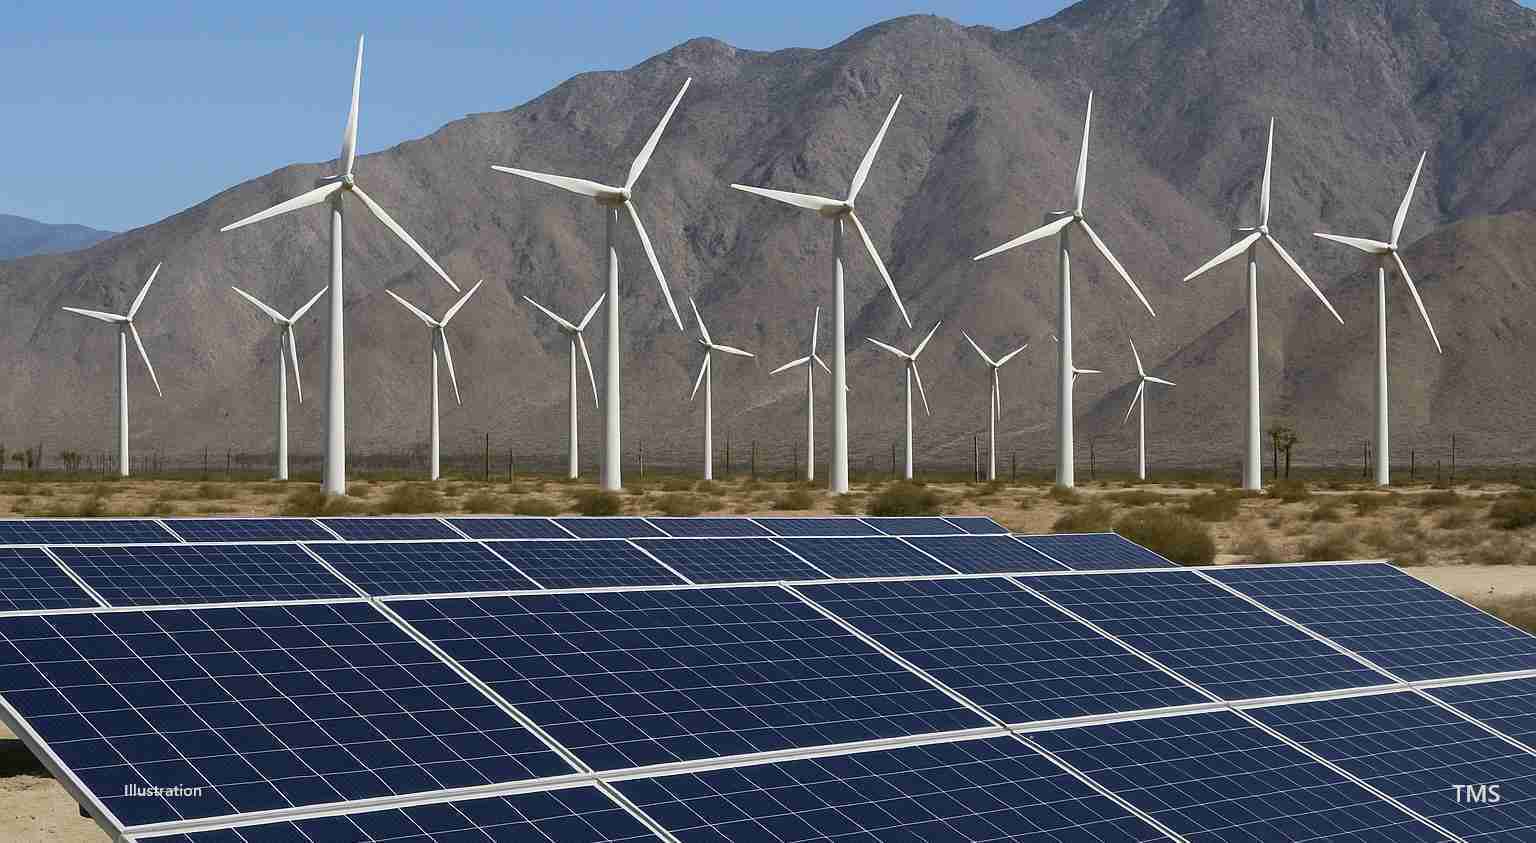
U.S. Breaks Renewable Energy Records as Solar and Wind Surge Nationwide
The United States shattered renewable energy records in 2024–25; in March 2025 clean sources — wind, solar, hydro and nuclear — supplied over 50% of electricity for the first month on record, signaling a rapid shift to lower‑carbon power.
- Historic month: clean sources produced over 50% of U.S. electricity for the first month on record, with wind and solar at a record 24.4% in March 2025 (Ember update).
- Record buildout: In 2024 the U.S. added a record 32.1 GW of utility-scale solar and 48.2 GW total new clean capacity.
- Generation shift: Wind and solar overtook coal in annual generation in 2024, supplying about 17% vs coal’s 15%.
- Regional leaders: Texas accounted for nearly half of new U.S. solar capacity so far in 2025 and is on track to add roughly 9.7 GW by year‑end.
Record month: clean energy tops 50%
March 2025 marked a milestone: for the first month on record, clean energy — counting wind, solar, hydro and nuclear — generated more than half of U.S. electricity. Analysts note that new capacity, favorable weather and available storage aligned to push the share above 50% for the month. Read the reporting at The Progress Playbook and Ember.
“The figures show how quickly the power mix can change when new capacity, favorable weather and storage line up.”
Solar and wind power growth driving change
Solar has been the fastest mover: utility-scale solar additions hit a record in 2024 with 32.1 GW installed (a roughly 65% increase year‑over‑year). Solar output rose 37% in March 2025 year‑over‑year, while wind generation grew about 12% that month.
Together, wind and solar overtook coal in annual generation in 2024 — supplying about 17% of U.S. electricity versus coal’s 15% — a shift tracked in the Ember 2025 special report.
State-level drivers: Texas, Florida and new markets
Concentrated growth. Much of the new solar and wind capacity is concentrated in a handful of states. Texas emerged as a leader, accounting for nearly half of new U.S. solar capacity in early 2025. Analysts expect Texas to add roughly 9.7 GW by year‑end.
Other fast‑growing solar states include Florida, Arkansas, Missouri and Louisiana, where land availability, state policy and grid access have aligned to spur projects (Canary Media).
Role of policy, costs and markets
Experts point to three main drivers: federal incentives, falling technology costs, and rapid private investment. The Inflation Reduction Act helped spur utility‑scale projects and battery storage, while panel and turbine prices have declined, boosting project economics.
Headwinds remain: policy uncertainty and potential regulatory changes could slow some projects in 2025. Still, if momentum holds, projections indicate a possible ~26% year‑on‑year increase in capacity additions (Canary Media analysis).
Battery storage and grid integration
Storage is scaling. Battery installations rose alongside renewables in 2024 and 2025, enabling more renewable output to be shifted into peak hours and improving short‑term reliability. However, experts stress that much more storage is needed to fully back up a high‑renewable grid during prolonged low‑wind or low‑sun periods (Energy Connects).
Fossil fuels still important, but losing share
Despite record months for clean energy, fossil fuels — especially natural gas — still produced over half of U.S. electricity on an annual basis in 2024. March 2025 was the first month that fossil fuels fell below 50% for the month (Ember), underscoring a rapid but uneven transition.
What this means for power markets and prices
Large additions of low‑marginal‑cost wind and solar tend to depress wholesale prices during sunny and windy hours, which can reduce fuel and operating costs for utilities and, over time, lower costs for ratepayers. The transition also creates needs for new transmission, more storage, and backup capacity — investments that often appear in utility plans, grid upgrade proposals, and local permitting debates.
Sources and reporting notes
This article draws on industry reporting and data from outlets tracking generation and capacity additions:
- https://theprogressplaybook.com/2025/04/04/clean-sources-produce-over-50-of-us-electricity-for-the-first-month-on-record/
- https://ember-energy.org/latest-updates/fossil-fuels-fall-below-50-of-us-electricity-for-the-first-month-on-record/
- https://ember-energy.org/latest-insights/us-electricity-2025-special-report/
- https://www.canarymedia.com/articles/clean-energy/the-us-smashed-clean-energy-records-last-year-can-it-keep-up-the-pace
- https://www.energyconnects.com/opinion/features/2025/august/record-breaking-year-ahead-for-us-power-generation-with-solar-leading-the-way/
Implications for Redding, California
Economic impact
Redding and Shasta County may see job growth in construction and operations, plus property tax revenue and land lease payments from larger utility projects. Rooftop solar and small‑scale storage could help household bills if paired with smart incentives (Canary Media).
Grid reliability and wildfire risk
Local grid reliability and wildfire risk are top concerns. More distributed solar plus battery storage can help communities ride through short outages and reduce stress on transmission during extreme heat. However, broader shifts require transmission upgrades and system planning that can be costly and slow (Energy Connects).
Civic and political consequences
A conservative audience in Redding will closely watch federal and state policy effects on local costs and control. While the Inflation Reduction Act helped drive renewable growth, local leaders may push for assurances on reliability, grid resilience and rate stability, plus stronger local permitting authority.
Social and community effects
Renewable projects can bring jobs and community investment but also spark debate over visual impacts, noise and construction traffic. Battery sites raise safety concerns; clear emergency plans and transparent public engagement will be key to community support.
Practical steps for Redding residents and leaders
- Assess local grid needs: Work with Pacific Gas & Electric and the state to prioritize resilience projects that reduce wildfire risk and support critical facilities.
- Encourage balanced permitting: Create rules that protect farmland and property rights while allowing community‑beneficial projects.
- Consider local storage: Promote rooftop solar with paired batteries and community storage pilots to keep power flowing during outages.
- Watch policy and markets: Track federal and state incentives and planned transmission upgrades (see The Progress Playbook, Ember).
Bottom line: The rapid growth in solar and wind and the record month for clean electricity are real and accelerating. Communities like Redding must balance capturing economic and resilience benefits with protecting local interests, ensuring reliability, and managing costs through careful planning.